The location of green infrastructure (GI) or low impact development (LID) to manage stormwater is a complicated question. The answer depends on what you want the GI/LID to do. Is it part of a climate change resiliency program or a carbon emission reduction plan? Perhaps the GI/LID is being used to meet water or air quality targets, or to meet recreational or public health needs.
GI/LID provides multiple benefits. These benefits, as well as local weather, soil, design storm requirements, and site conditions all vary geographically. Autocase has local data so when you locate your projects the relevant information is brought into your Triple Bottom Line Costs Benefit Analysis (TBL-CBA) for the GI/LID on your site.
To illustrate Autocase’s local data, I modeled a standard bioswale/rain garden of 100m2 to capture the runoff from a parking lot (500m2) and a grey roof (1,300m2) on a site with unmanaged turf (300m2). Because I wanted to capture the planning uncertainty I put ranges around each of these features – hence the fuzzy sketch below 🙂 …
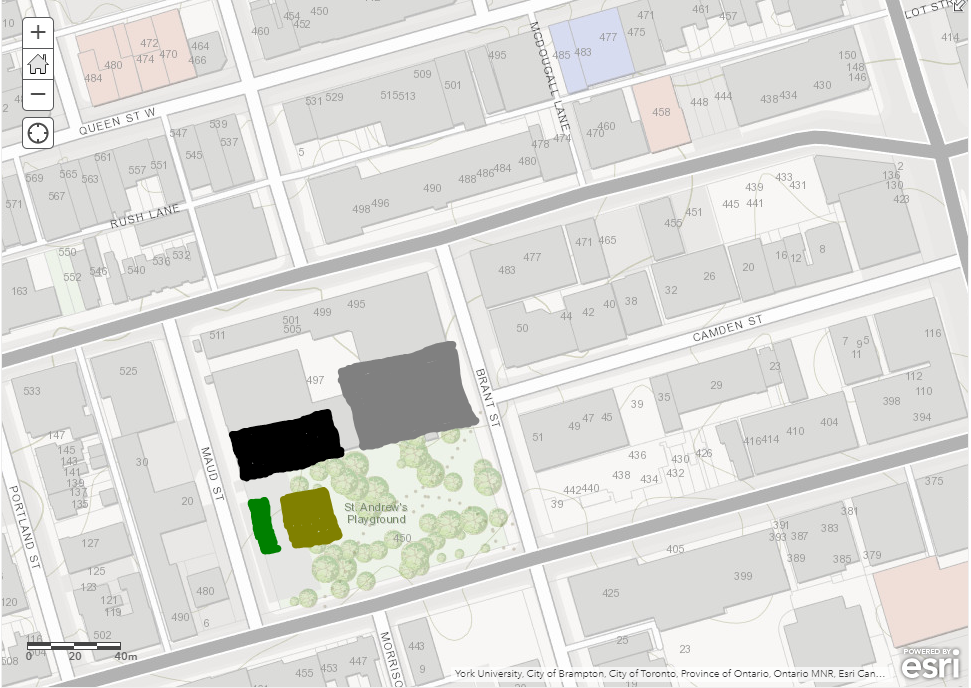
I used Esri’s wonderful ArcGIS Online (and a site near our Toronto office) to develop my prototype.
Then I ran the preliminary site design in Autocase’s around 450 locations. I pulled the results from Autocase for Sites into ArcGIS Online to display the results. Rainy British Columbia gets the highest overall net present value (NPV) when you add up of all of the costs and benefits of the bioswale/rain garden:
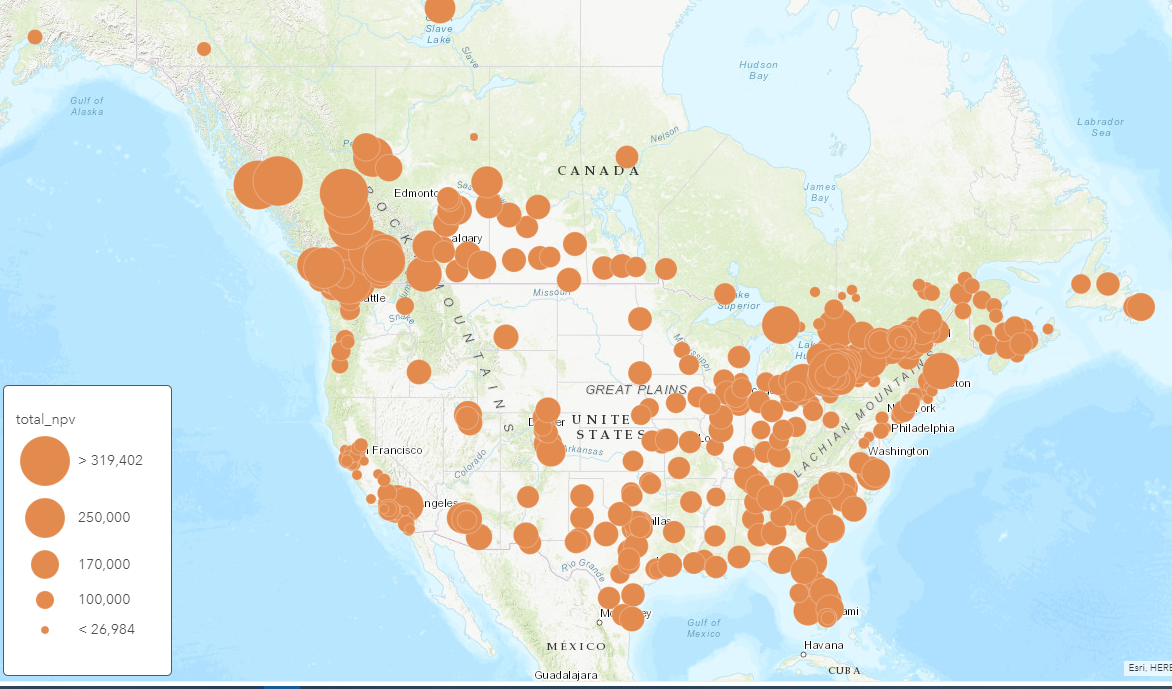
Geographic differences matter. The TBL-CBA value of the rain garden varies between $7,600 and $400,000 over its life (with an average of $27,000).
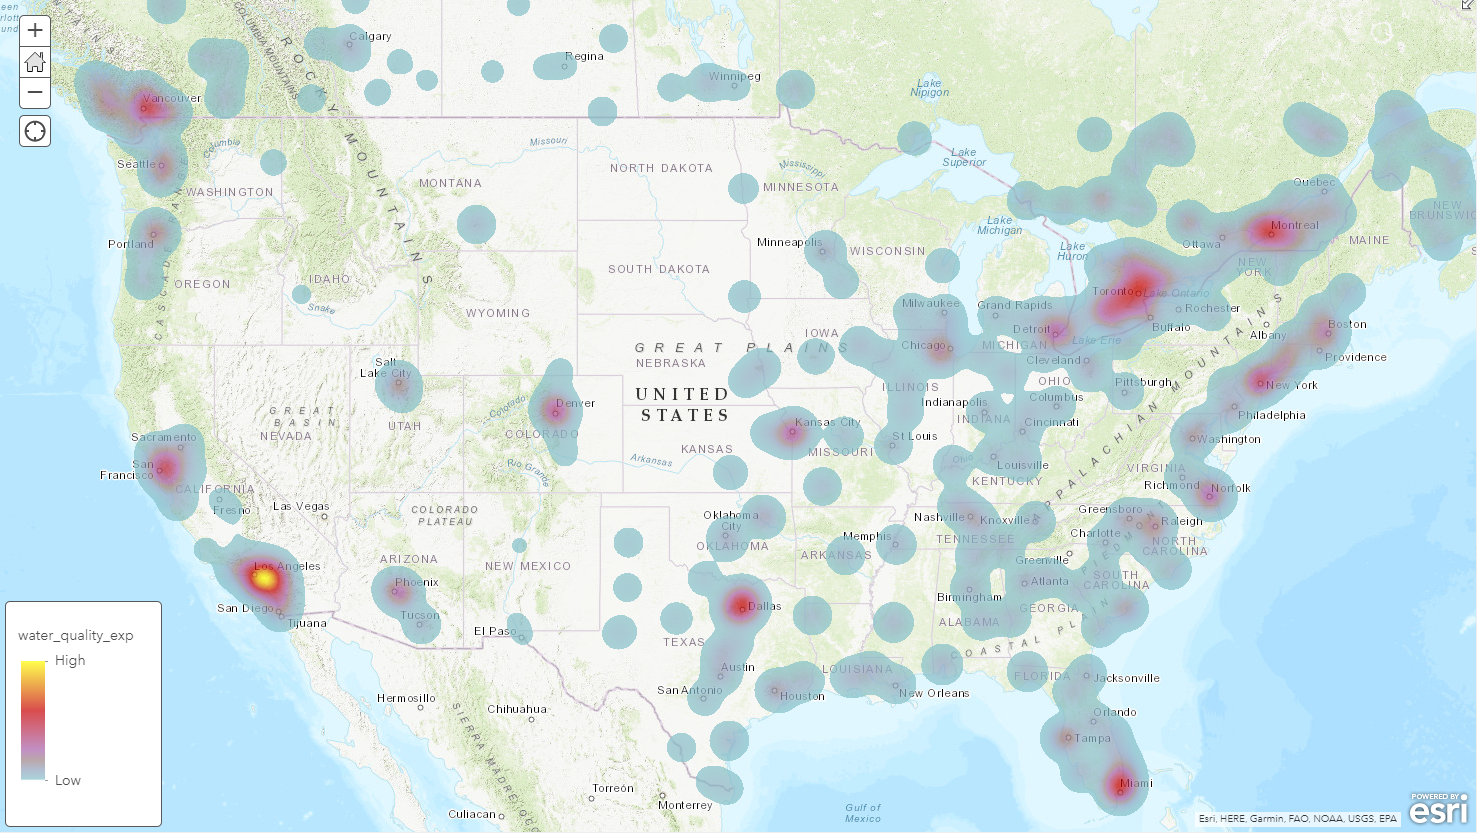
But what about if you were primarily concerned with water quality? Then the highest benefits are in the Los Angeles area:
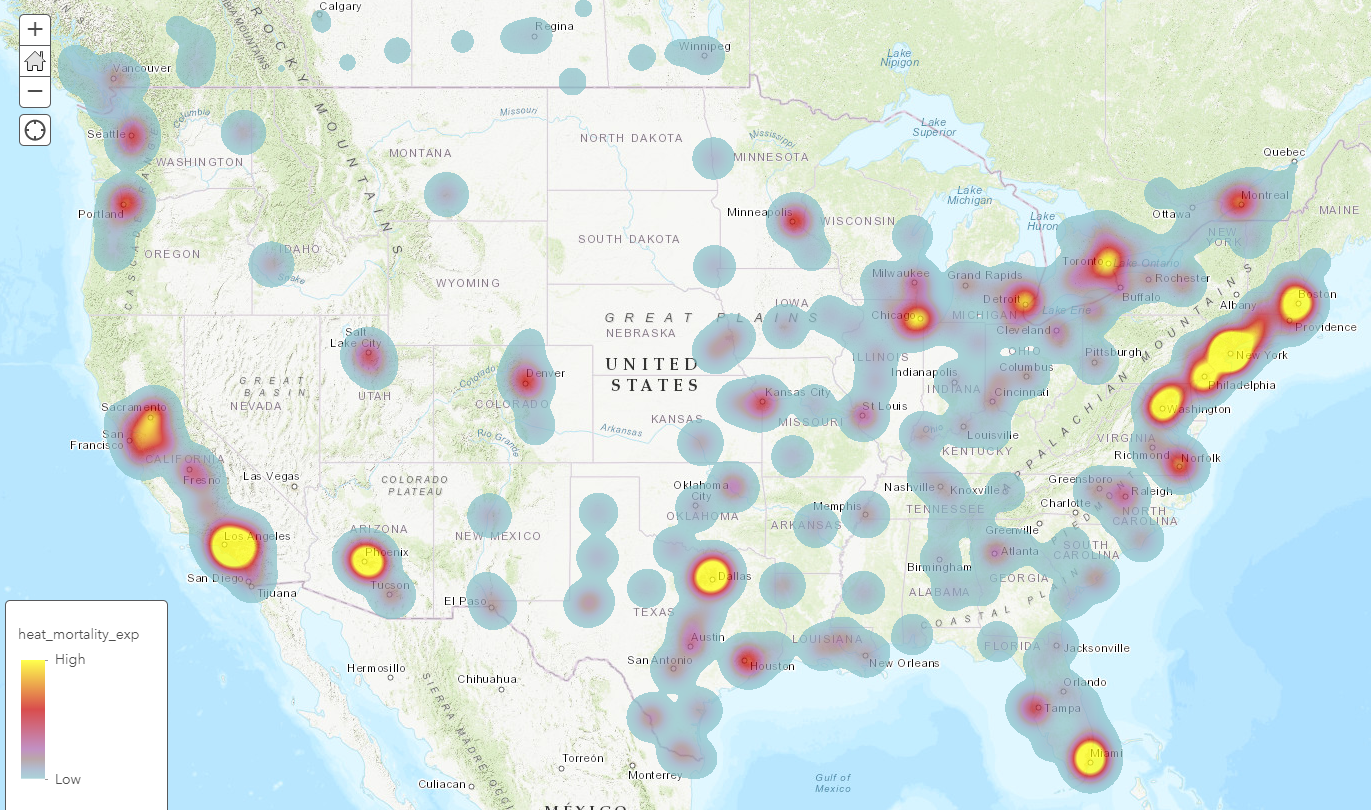
And if you wanted to use the GI/LID to mitigate the urban heat island (Autocase for Sites now lets you choose your climate change scenario for temperatures)? The highest benefits, measured by reduction in people killed by extreme heat events, are in the populous cities in the North East: 1) New York, 2) Philadelphia, 3) Jersey City, 4) Boston, 5) Miami, 6) Baltimore, 7) Washington, etc. There are some obvious places where urban heat island benefits peak – Phoenix and Dallas:
Not many people will have all of North America as their GI/LID canvas but cities such as Edmonton have used Autocase to maximize the net benefits (benefits minus costs) and choose from amongst tens of thousands of potential sites and a range of GI/LID features:
EOR did a GIS site suitability analysis and came up with over 85,000 LID retrofit opportunities, over 33,000 on public land). But without the billions of dollars to retrofit all of these sites Autocase was used to prioritize the best features on the best sites.
Cities seeking to become more resilient now have a powerful tool that enables them to prioritize sites and GI/LID features. Watershed-level analysis of multiple sites can be run quickly with Autocase for Sites. Results can be evaluated based on their ability to meet flooding, water quality, lifecycle cost, or other benefit of cost categories. If you are interested in optimizing your GI/LID site selection – contact me.