There are thousands of grade crossings in North America. Each is a safety concern.
- About every 3 hours a person or vehicle is hit by a train in the US.
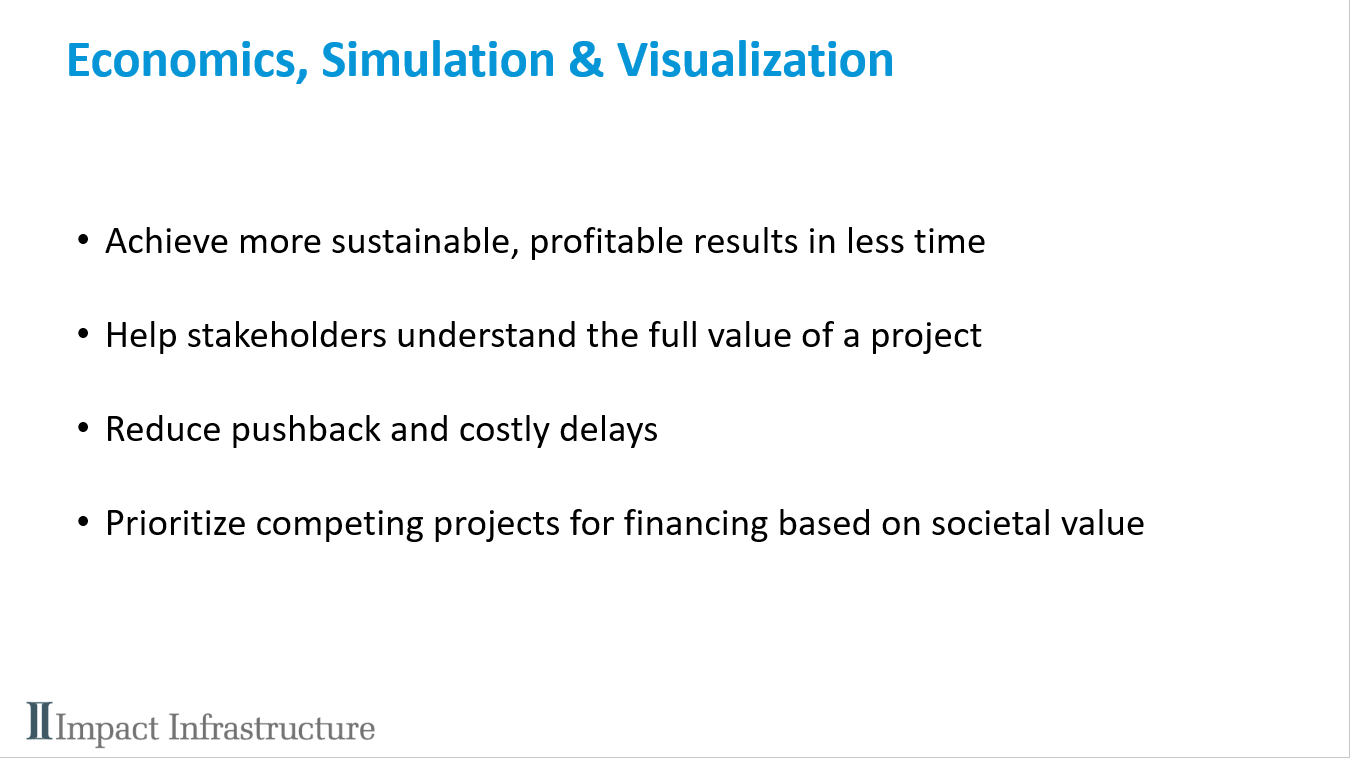
Roads and railways don’t mix – that is why we have signaled crossings when traffic warrants it. In this post I am going to show you how economic analysis can be linked to the output of Infraworks 360 and its traffic and mobility simulator so you can show the alternatives as powerful visualizations and make the business case by showing stakeholders the full value of alternatives.
In most cases the railways were there first and the development and roads followed later but opposition to crossings that are not grade separated is intense. People who have to cross rail tracks don’t want to wait for trains or drive around them to a nearby bridge or tunnel. They want the railroad grade separated from the road so traffic and trains can travel unimpeded.
The railroads have separated a lot of crossings and have made transportation much safer but often at a large cost. Each crossing is different and requires careful analysis of the costs, benefits and risks. There are diminishing returns to the endeavours of railroad planners as stakeholders want to see changes, understand the impacts on their commute, and want the railroads to make the business case for the alternatives. All of which is time-consuming and costly.
First a definition and some statistics.
- A grade crossing (or level crossing) is an intersection where a road or path crosses railway tracks at the same level.
- Every day trains travel across more than 212,000 highway-rail grade crossings.
- 2/3 of crossings have gates, bells and/or flashing lights. 1/3 are passive.
- As mentioned above, about every 3 hours a person or vehicle is hit by a train in the US and 96% of all rail-related fatalities and injuries occur at railroad crossings or are due to trespassing.
- Although fatalities at U.S. crossings have declined substantially. -24 % in the past 10 years, 2014 saw 270 fatalities (an increase of 40 from the previous year)
We are experimenting with using Infraworks as a valuable tool in making the business case for the design alternatives for grade separations. This is an illustrative example of the problems that can occur when trains, pedestrians, and cars mix.
In the video below, of Edmonds, WA, there has been congestion at the railway tracks since the 1920’s:
In the video above you will see an Infraworks Model Builder Model of the waterfront in Edmonds, Washington. The BNSF track separates the town from a busy waterfront and ferry.
- For years, the trains, auto and ferry traffic converging within a few blocks of the waterfront area have created major traffic jams.
- Each year some 3.8 million people either drive or walk onto the Edmonds-Kingston ferry.
- More than 40 trains block waterfront access for about 80 minutes each day.
- If there’s an accident or a train beaks down, it can cut off access to the waterfront for hours and slow emergency responders.
- This tragically happened on April 19 this year when a pedestrian died after running onto the railroad tracks as a train was approaching.
- With the train stopped on the tracks three hours, no one could access or leave the waterfront area.
- There were two medical emergencies, a woman about to deliver a baby and an injured child who needed medical attention.
- The fire department had to get permission from BNSF to go through a rail car to get to the patients.
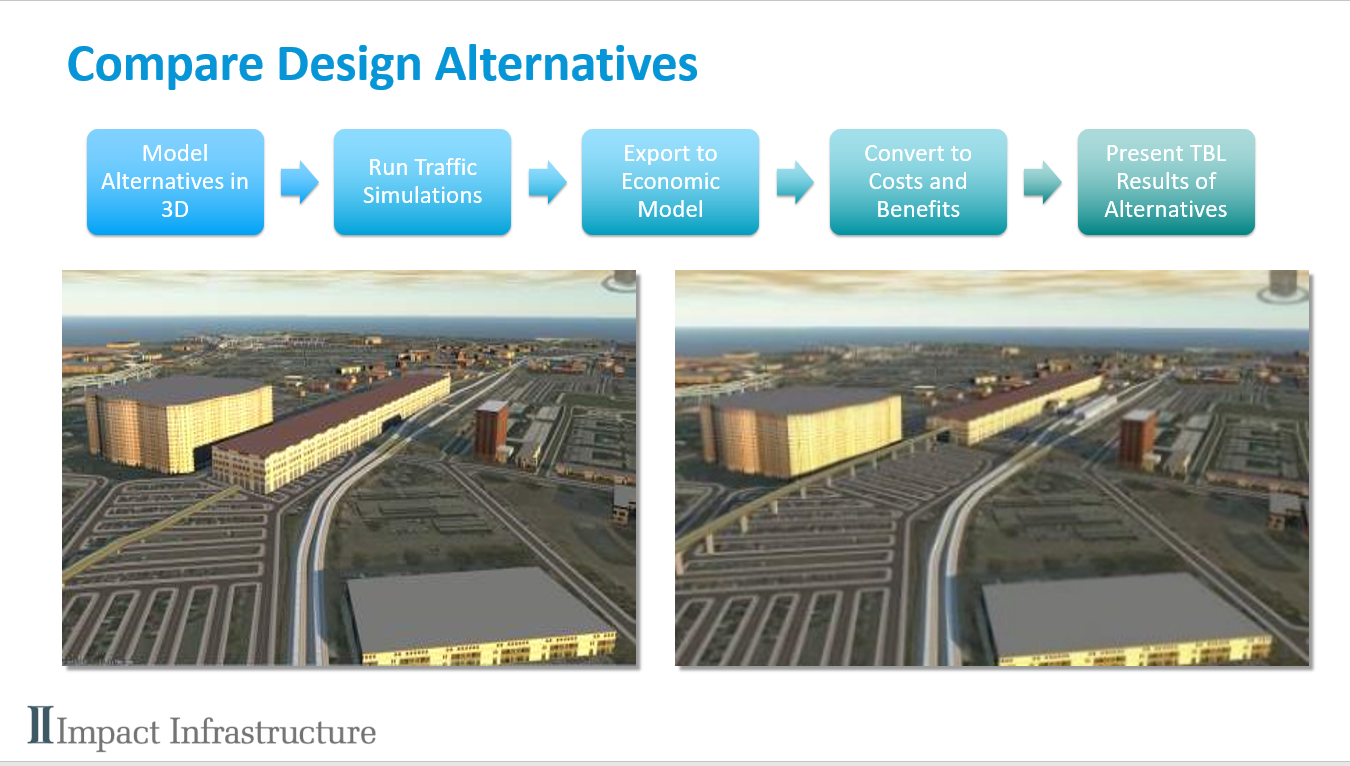
At Impact Infrastructure, we are experimenting with helping transportation planners and engineers understand the trade-offs involved in grade separated crossings. Here’s the current workflow:
- We are using Infraworks 360 (IW360) to quickly and easily generate interactive 3D visualizations of existing grade crossing, and various bridge tunnel and road closure alternatives
- Generate traffic simulations
- Export micro-simulation to our economic model
- Convert traffic data to cost-benefit analysis to show the value of emissions, value of time, travel reliability, traffic congestion, safety, and health
- Present Triple Bottom Line (TBL) results beside the IW360 visualization.
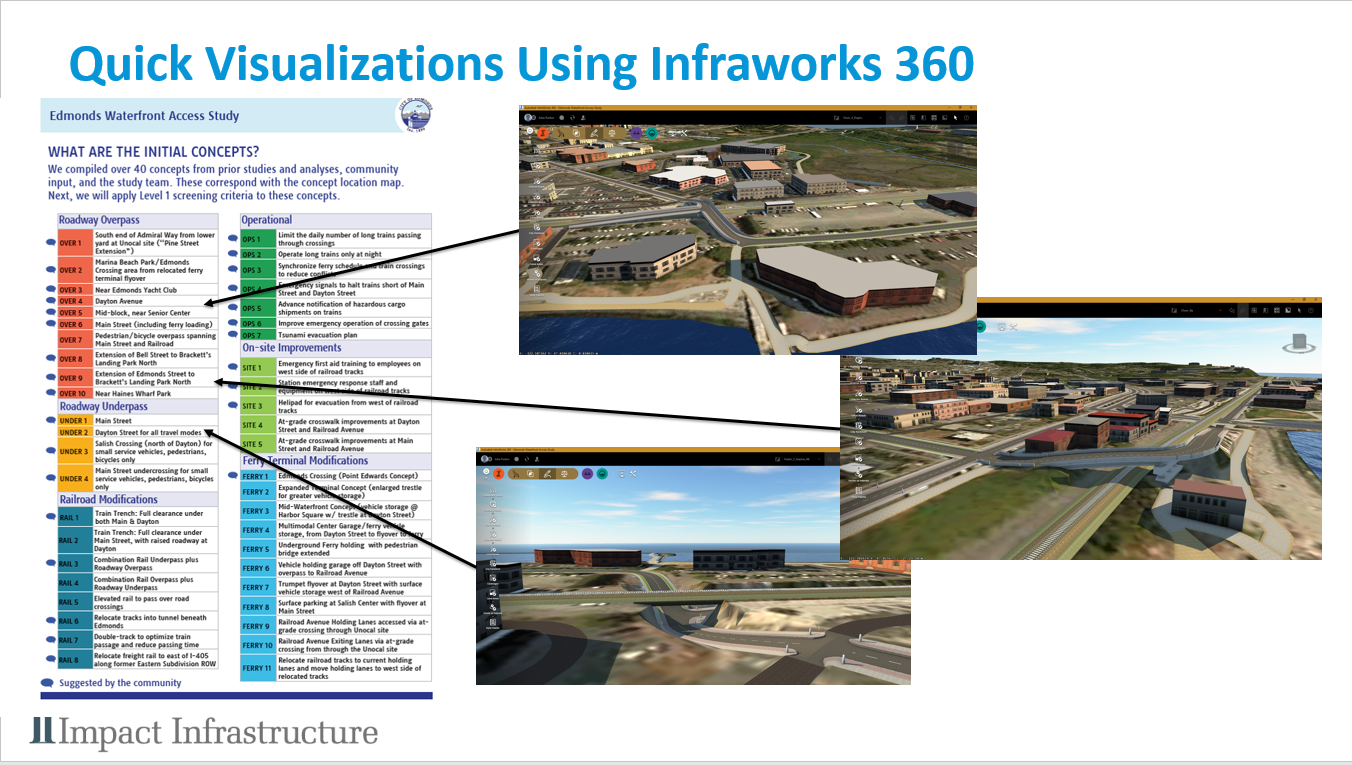
Here are a couple of the concepts that have been considered for Edmonds and the same concepts I have created in Infraworks.
We then feed the traffic counts, from a Port of Edmonds Port Commission meeting, into Infraworks.
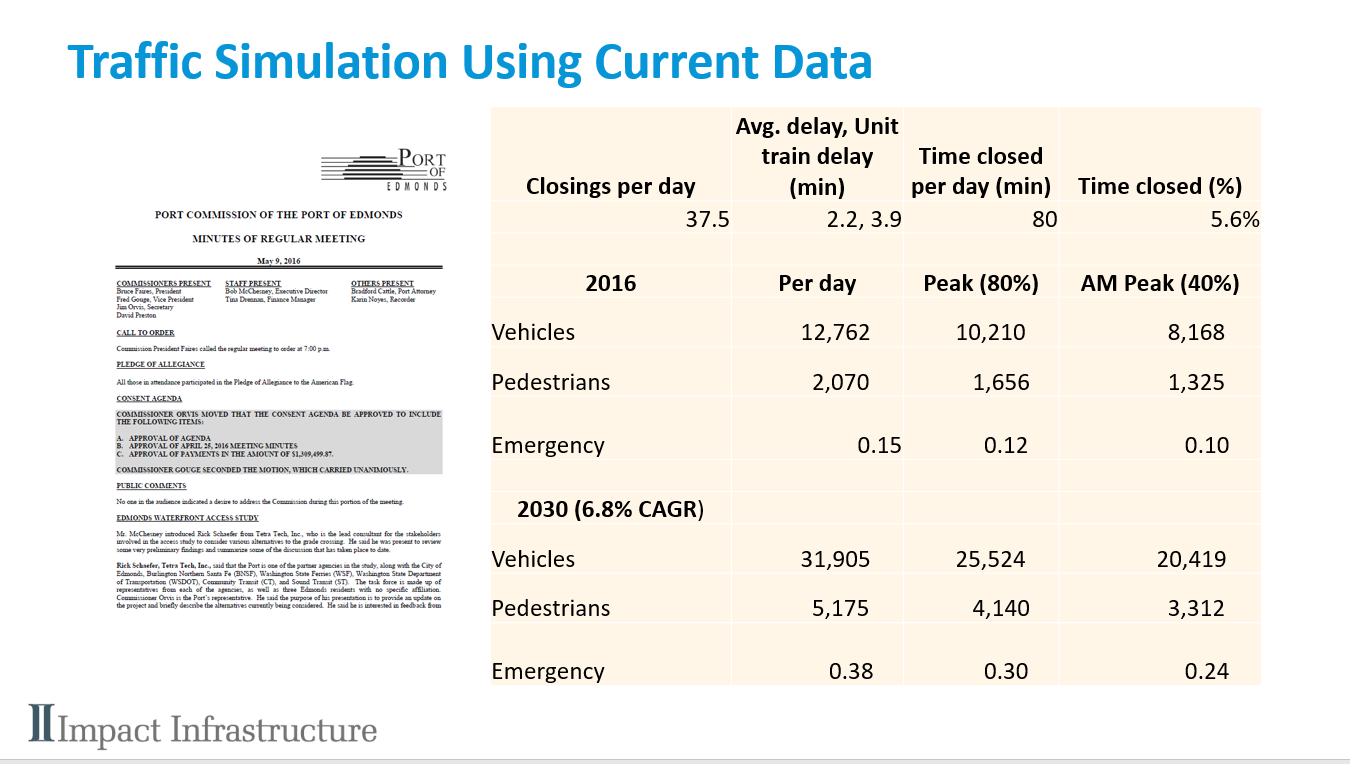
This data shows the vehicles, pedestrians and emergency vehicles now and expected in the future. It also shows the number of times access to the waterfront is restricted because of passing trains and the delay that can be expected.
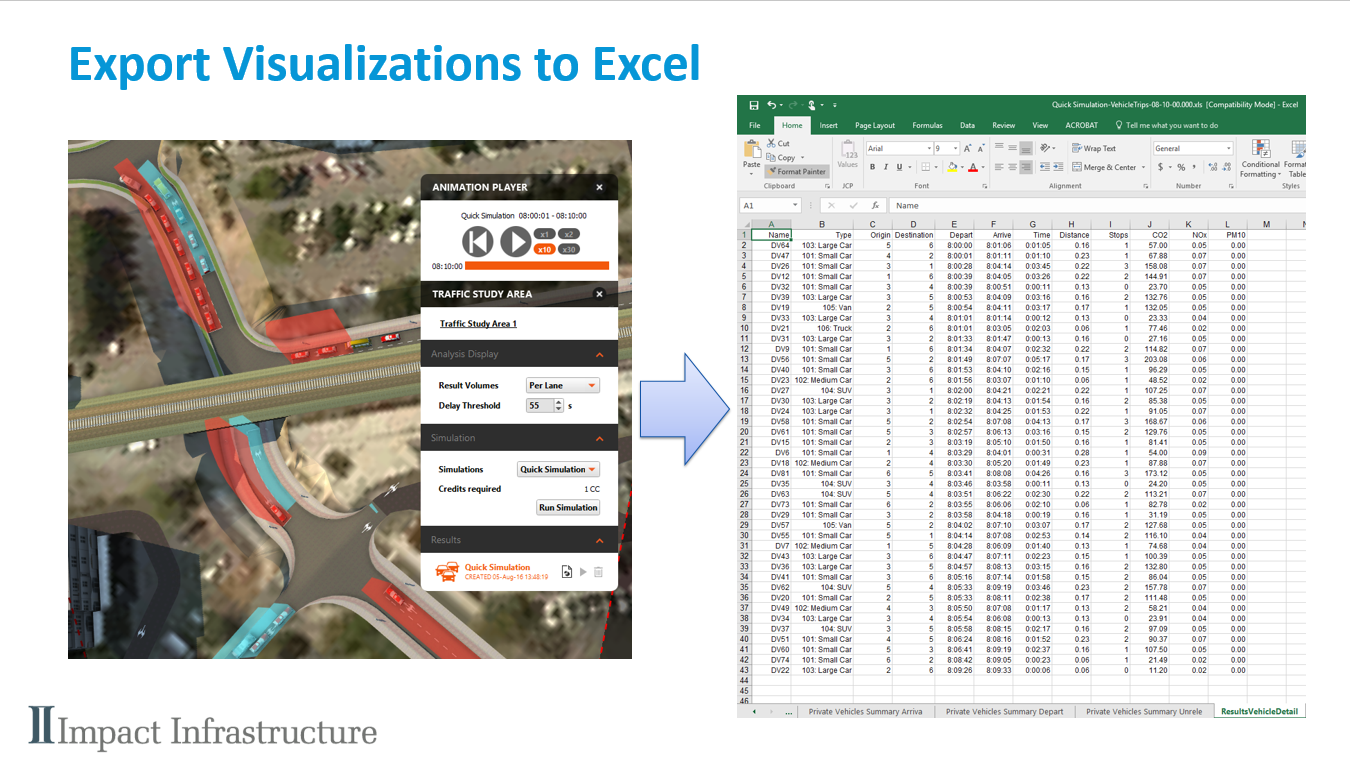
We then simulate traffic using Infraworks’ Traffic Simulator and export the results. This allows:
- Different value of time and emissions by vehicle type
- Can simulate pedestrians, cyclists, public transit, freight, and emergency vehicles
- Can use variance in travel time to value reliability
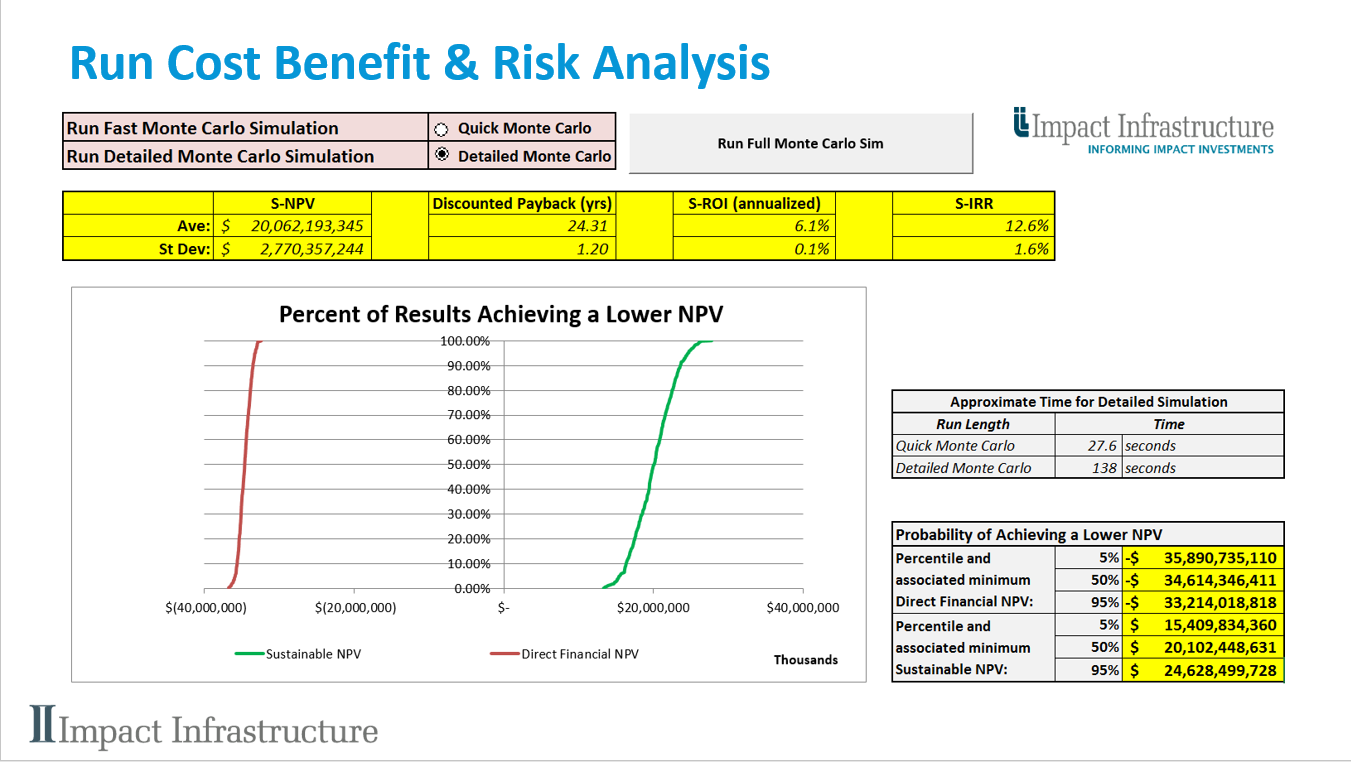
Then we have all the information we need to calculate the economic value of the design alternative. Because of the detail in the traffic simulation we are able to model the risk associated with our benefits calculations.
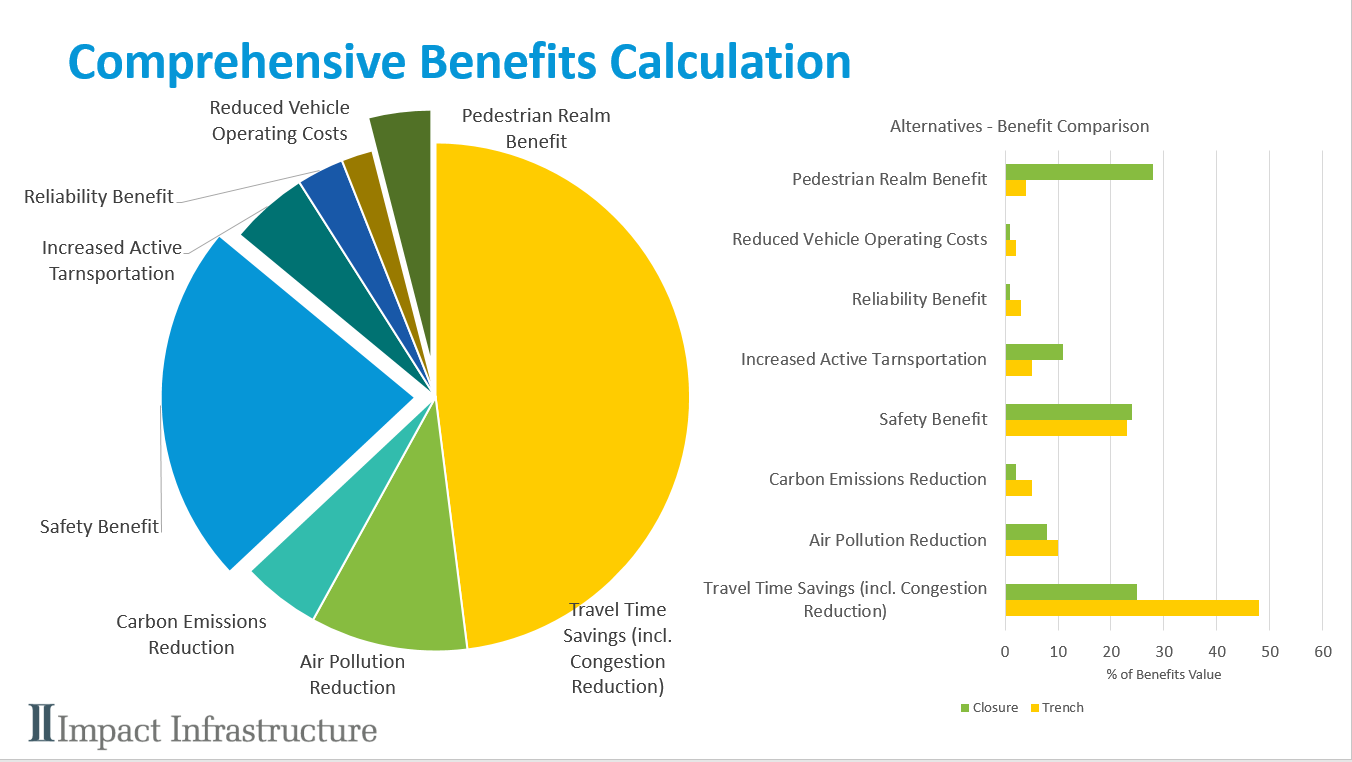
And show a list of benefits for each alternative. This allows stakeholders to see how the alternatives stack up in terms that they may be most interested in.
Another example where it is increased rail traffic is an issue is the California High Speed Rail initiative where electrification, double trains and addition of high speed rail to existing commuter rail corridors is occurring.
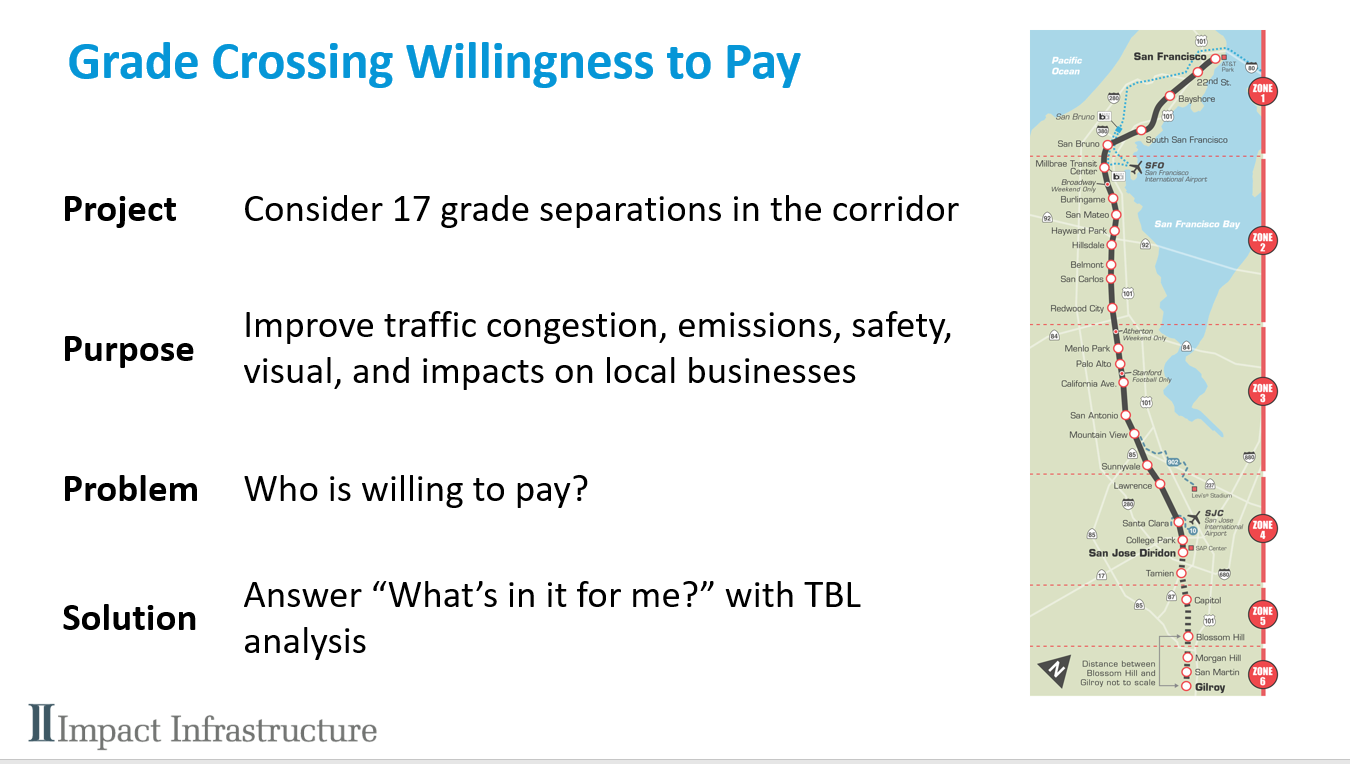
Here is one of those crossings – Castro Street in Mountain View.
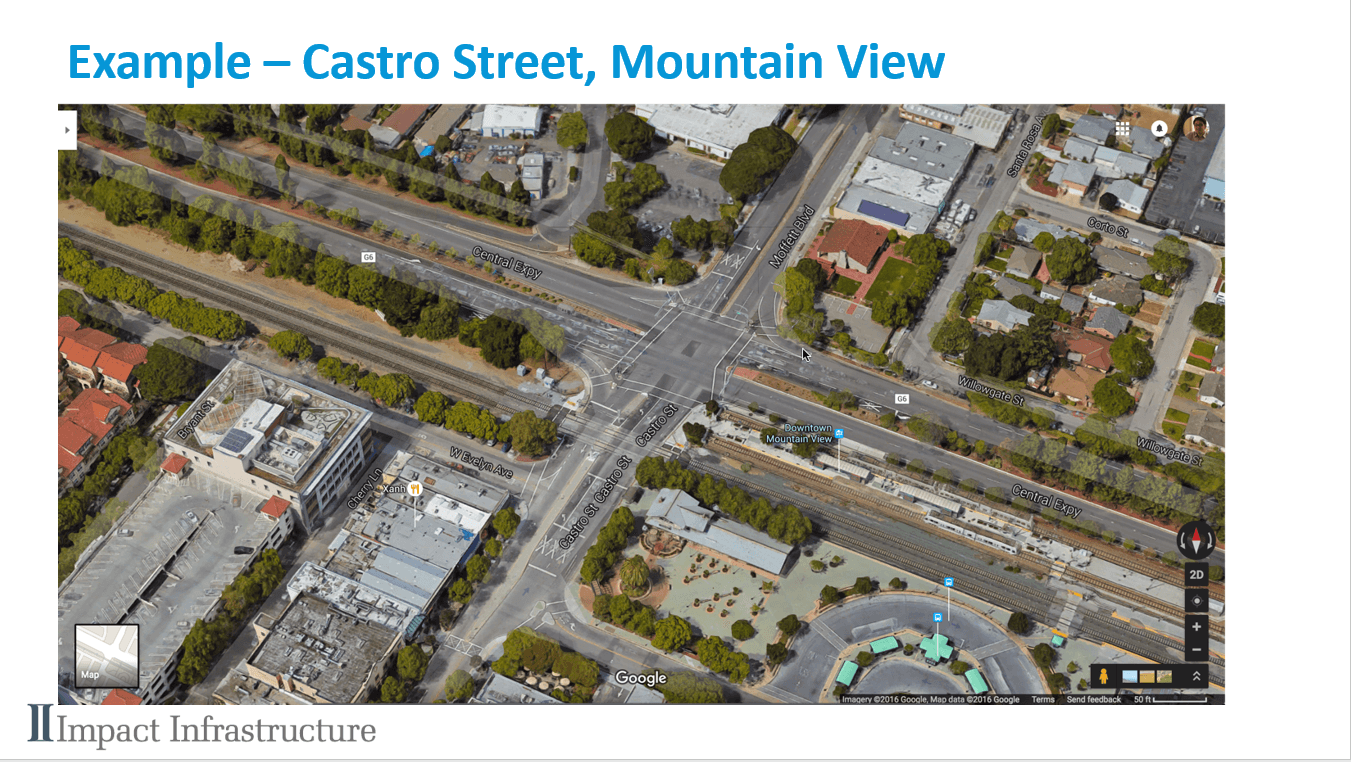
Castro Street currently crosses a Caltrain train track at grade. High speed rail is being added.
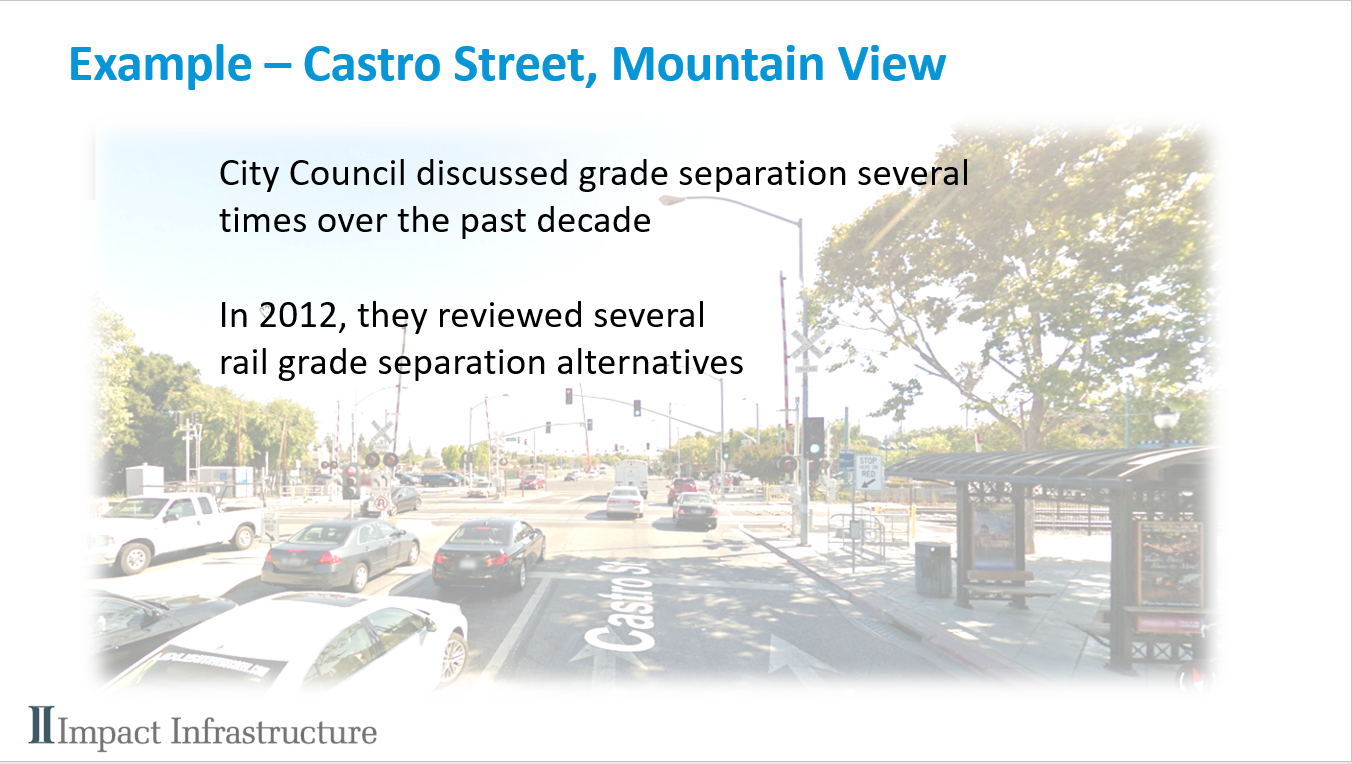
City Council discussed grade separation several times over the past decade. In 2012, they reviewed several rail grade separation alternatives.
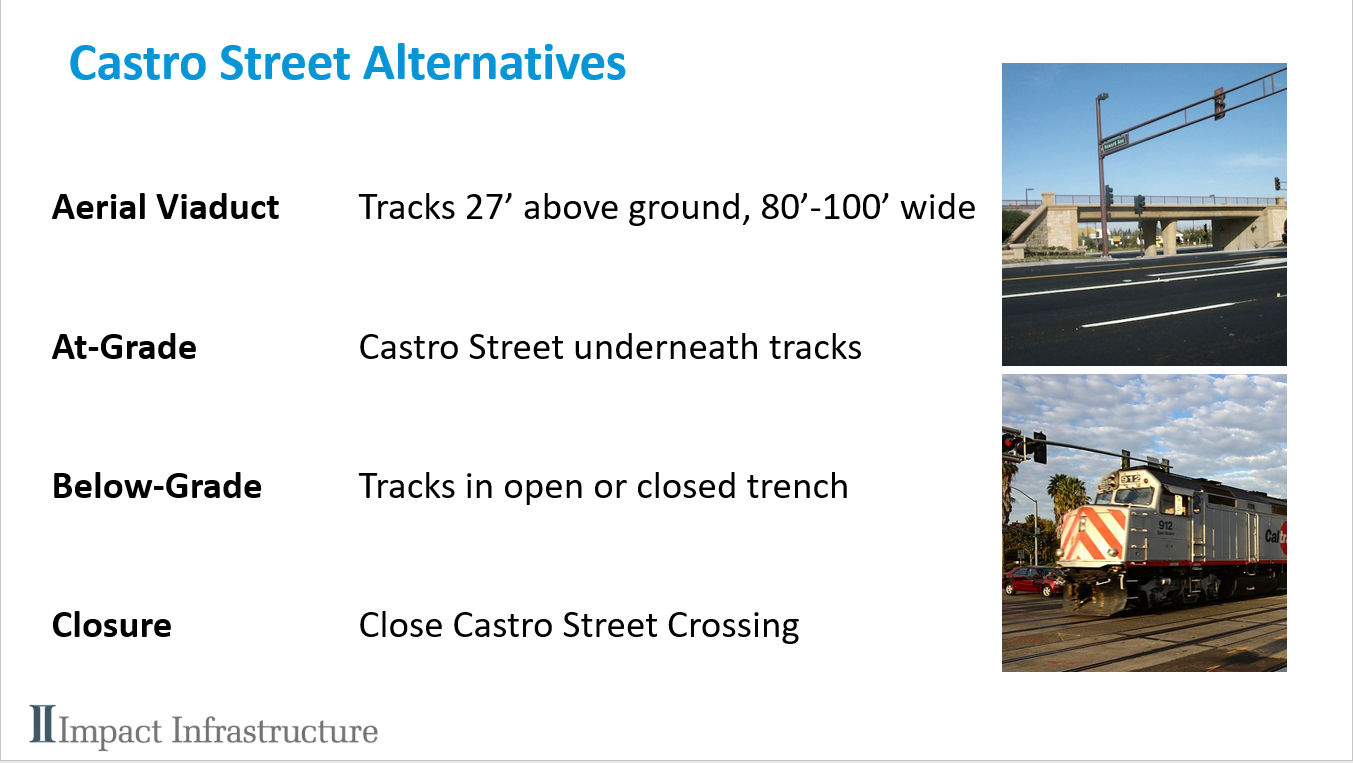
Capital costs for moving the railroad would be substantial between around $130 million and $1.2 billion. One option that was discussed briefly was closure of the street.
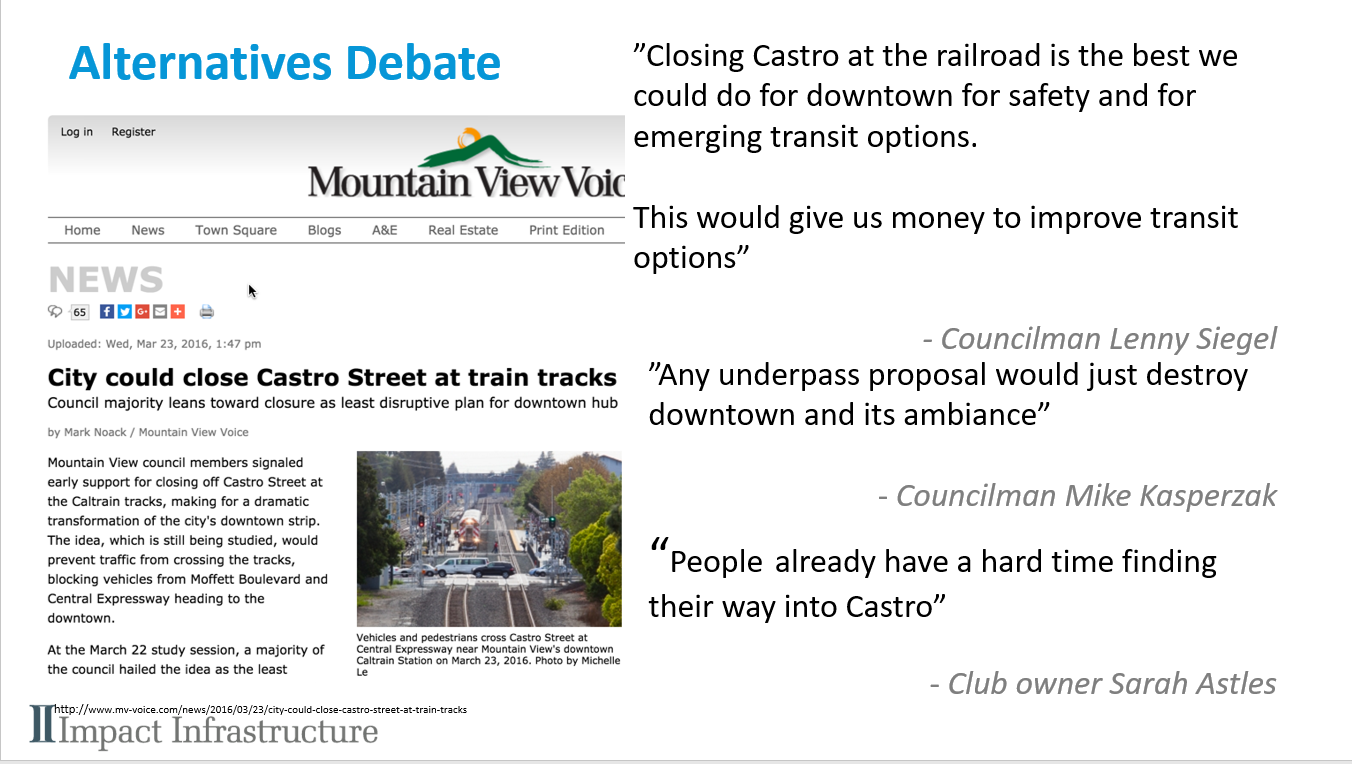
As usual with these projects people have different perspectives. Closure is cheapest. Other grade separations may affect accessibility and desirability of the downtown.
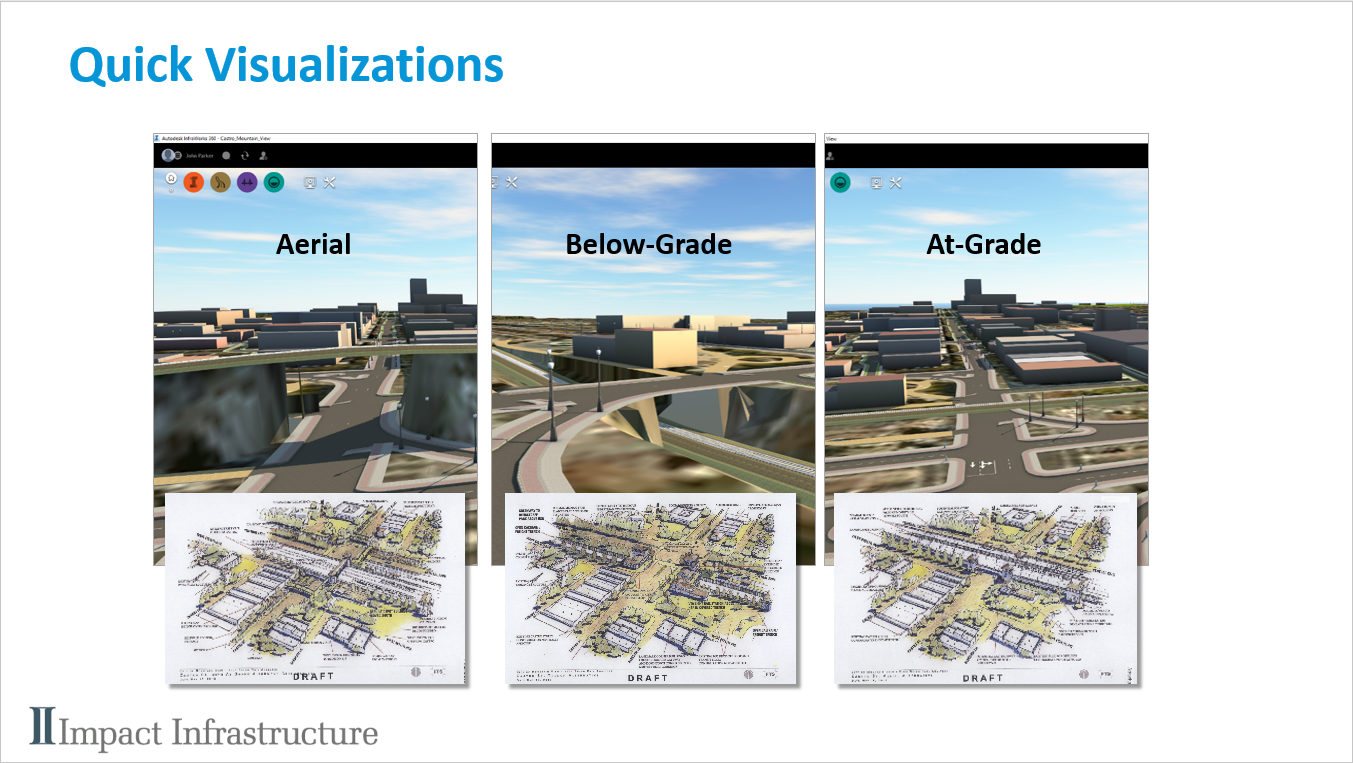
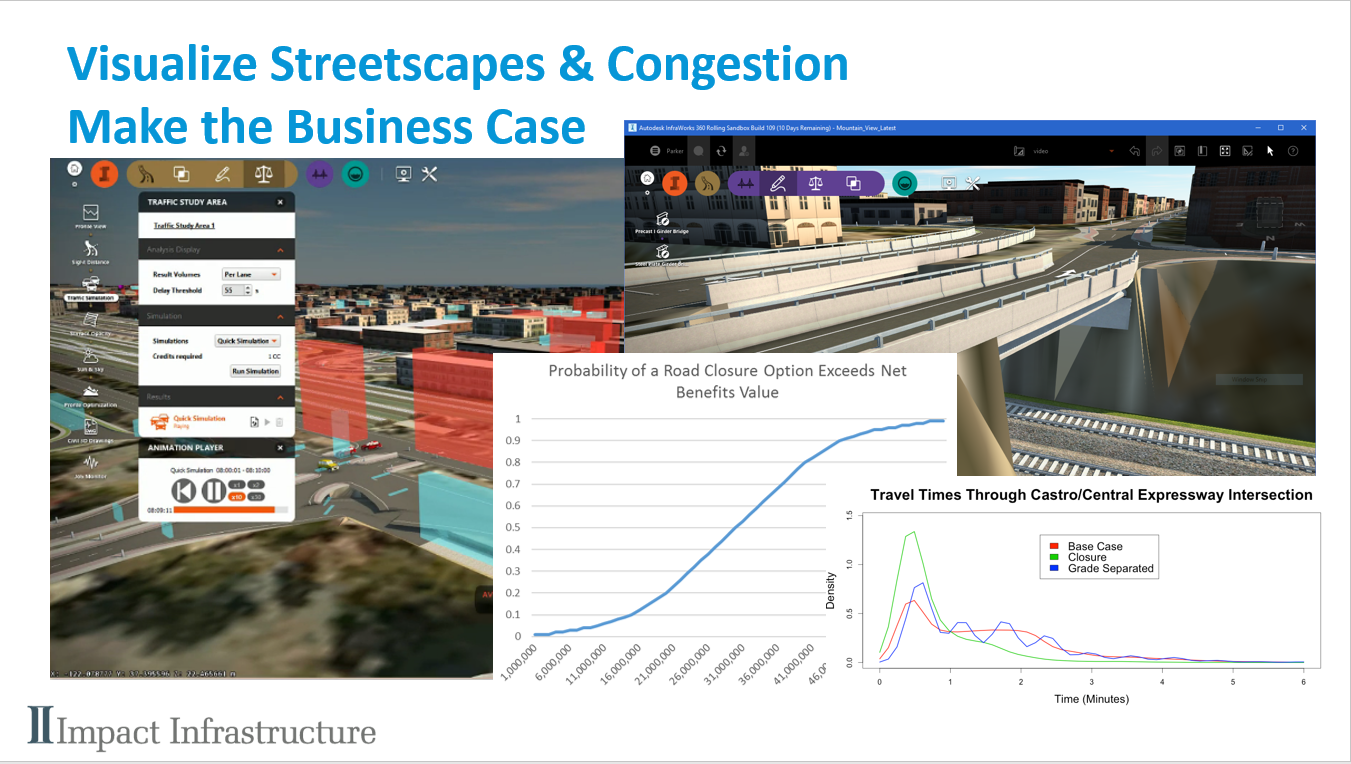
As we have seen Infraworks allows rapid visualizations of the alternatives rail-road crossings. And now, with traffic and mobility simulators, it can show the effects on traffic. Exciting for me is that these traffic simulations can be linked to economic models that value the time, emissions, congestion and travel reliability as well as the safety benefits.
We at Impact Infrastructure have been investigating the ability to link powerful visualizations, traffic-rail simulations and economic models that give a triple bottom line value to these alternatives.
Talking about intersection level of service and road capacity may excite transportation engineers but seeing queues or free flowing traffic is what concerned neighbours want. Visualizations and simulations help build engagement and reduce project delays. Automating the economic triple bottom line allows people to see how the air quality, safety, and congestion costs and benefits stack up.
Sometimes interesting aha moments become evident. Closing a street means that people have to drive around the crossing and longer travel times are annoying and bad for the environment. However, it eliminates collisions and may create a pedestrian realm that has retail and health benefits that may outweigh the costs. The cost of building a trench or flyover for the new high speed train is very expensive. Closing a street is a much cheaper option and potentially attractive option. It brings a better streetscape, increased safety, and makes the road more pedestrian friendly.
This is just one example of how we can integrate economics into an engineer’s or planner’s workflow.
- Our Autocase for Buildings software automates analysis of the triple bottom line of sustainable LEED building design.
- And our Autocase for Green Infrastructure makes the business case for sustainable stormwater management.
Infraworks is democratizing powerful modelling, visualization, and simulation tools.
Impact Infrastructure is working to use these tools and allow for automation of the economic triple bottom line that will provide real time economic, environmental and social to engineers and designers.
Impact Infrastructure’s Autocase software is helping to make the business case to support the highest value and safest alternative.
0 Comments