Here are more examples of how CBA-BIM can make CBA relevant again by calculating sustainability impact value:
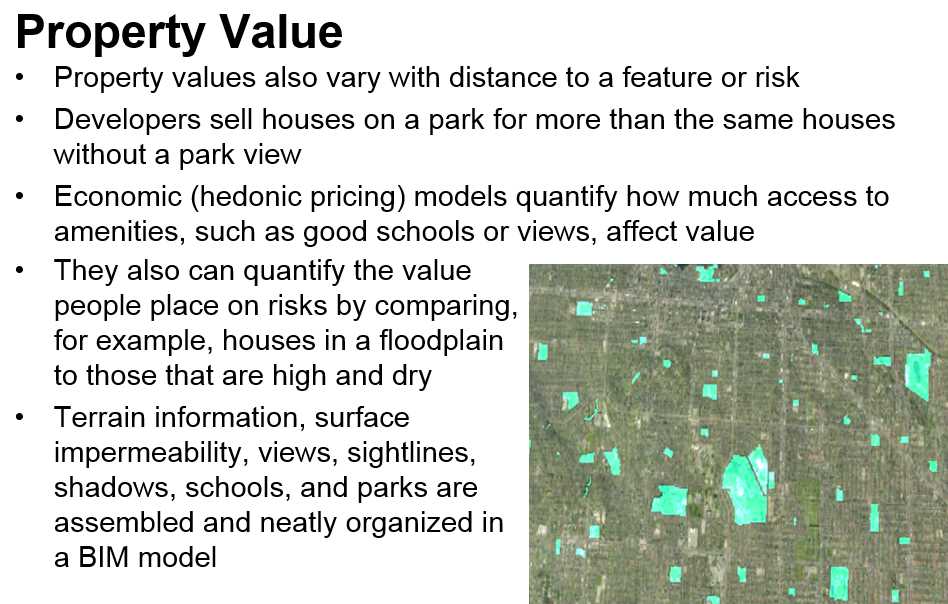
- Property values vary with distance to a feature or risk. Developers sell houses on a park for more than the same houses without a park view. Economic (hedonic pricing) models quantify how much access to amenities, such as good schools or views, affect value. They also can quantify the value people place on risks by comparing, for example, houses in a floodplain to those that are high and dry. Terrain information, surface impermeability, views, sightlines, shadows, schools, and parks are assembled and neatly organized in a BIM model.
-
Property tax assessments already use hedonic pricing models – you pay more tax based on the characteristics and location of your house. Now infrastructure’s impact on property values can be assessed at the planning stage and the effects of changing the design can be understood in terms of government finances.
- Tree density, often easily available and able to be pulled into a BIM model, affects the urban heat-island effect. Temperatures in excess of a certain threshold can kill people. Population density layered on top of tree density allows economists to put a value to how trees reduce the number of people dying from excessive heat events.
- Transit locations, trail and bike path information can be overlaid with income, health, and job information. Low income neighborhoods can benefit from increased access to job opportunities when there is an improvement in transportation; this benefit can be quantified. So can the economic value of reductions in obesity rates or diabetes risk that can result from increased access to transportation or increased recreational use space. By simply placing a new transit stop in a BIM model and triangulating the distances to job prospects and health-care centers, economic benefits and health benefits can be calculated, monetized and compared with costs of that transit stop.
Increased job opportunities, better health-care and local air quality answer the “what’s in it for me?” question of low-income households
- Local pollution has different economic damage costs depending on where the pollution is emitted. In dense urban areas, damages to health and buildings are more than in less dense urban environments. Damages to health and buildings in rural locations are less again. For projects that change pollution, BIM allows local air quality to be modeled based on the number of trees, distance to pollution source, elevation, density and value of people, buildings, and crops. It can show which neighborhoods benefit and by how much.
0 Comments