One of questions we get most frequently is “where does that number come from?”
Autocase automates Triple Bottom Line Cost Benefit Analysis (TBL-CBA) for new, retrofit, and renovation of buildings. Because we’ve automated a complicated process the software does a lot for you. When you locate a project Autocase assembles all of the data you need. By using consistent methodologies and data across North America the TBL-CBA results are comparable across projects and designs. And we provide you with defaults inputs based on government, regulatory and industry standards. But we allow you to override these inputs with your own information.
And when you are exploring your results we allow you to drill down to find out where the results came from. You can drill-down in our interactive charts to see what is driving the value in your design. For example, the productivity benefit to occupants may be a large source of the value. But where does that come from? As shown here, clicking on the productivity bar in the graph that shows value by cost/benefit type provides the answer.
The video below shows another approach that provides even more detail on the source of the value your design creates.
Level 1: Whose Benefit?
The results table below the value graphs for each design shows that the productivity benefit contributes to the social bottom line in the triple bottom line framework. It also shows that it accrues to the building occupant. These are, of course Autocase defaults, but you can change them (using the Edit Stakeholders button under the results table).
Level 2: What’s Driving Value?
You can also click on the table to get more detail. In the example shown above, clicking on the productivity benefit shows that it comes from the improvements made in lighting, building site lines, and heating ventilation and air conditioning. Clicking on each of these lines in the results table shows the documentation for that benefit or cost in the right hand pane.
Level 3: How’s that Value Calculated?
For example, clicking on the HVAC benefit in the table brings up the documentation and show that this benefit comes from thermal comfort, ventilation, and filtration. To understand the ventilation benefit in particular, increasing the building’s air flow rate, up to a point, increases productivity, decreases illness-related costs, and decreases absenteeism from work due to these illnesses.
Level 4: What’s the Source Study and Data for the Value?
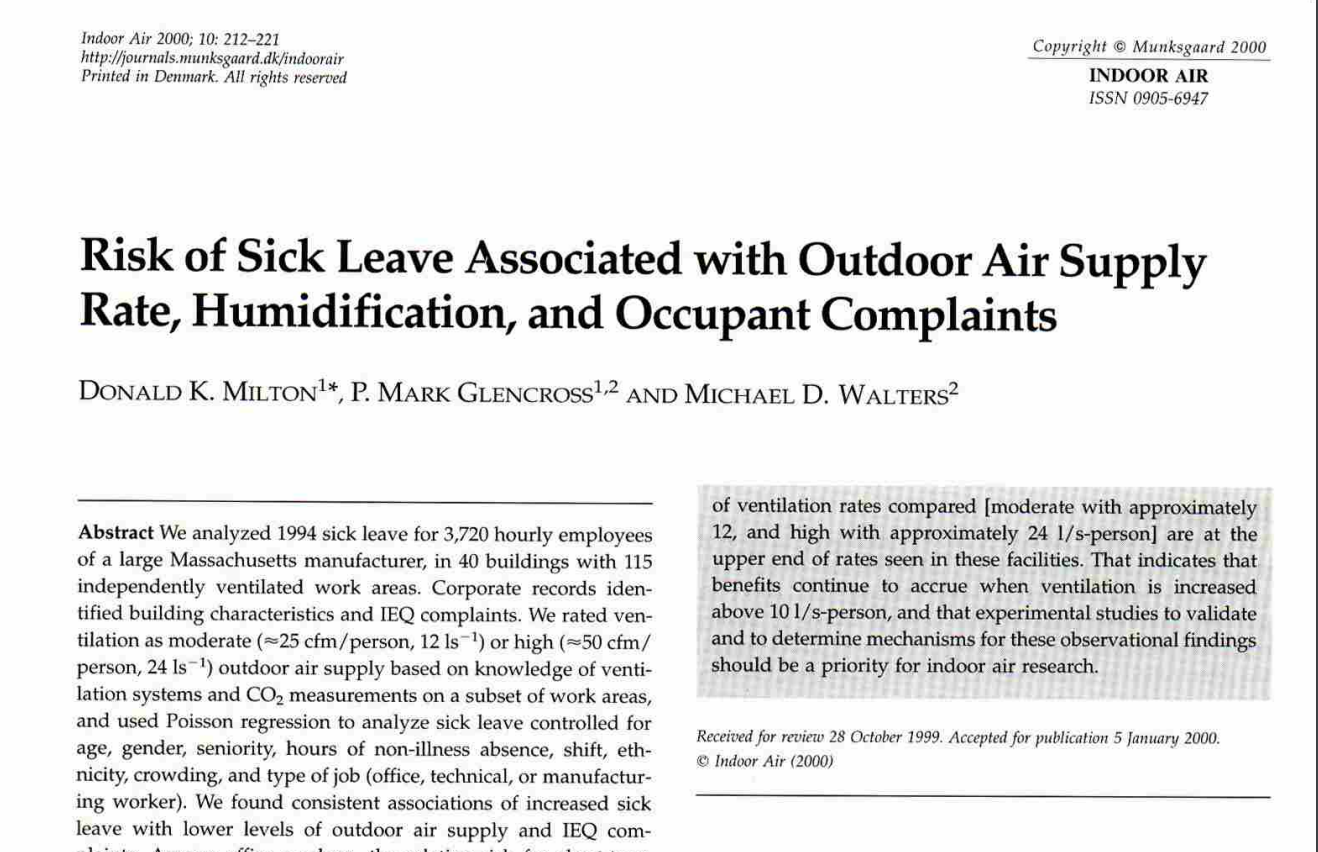
If you want to understand the link between ventilation and absenteeism you can see we use:
- Milton, D. K., Glencross, P. M., & Walters, M. D. (2000). Risk of sick leave associated with outdoor ventilation level, humidification, and building related complaints. Indoor Air, 10(4), 212-21.
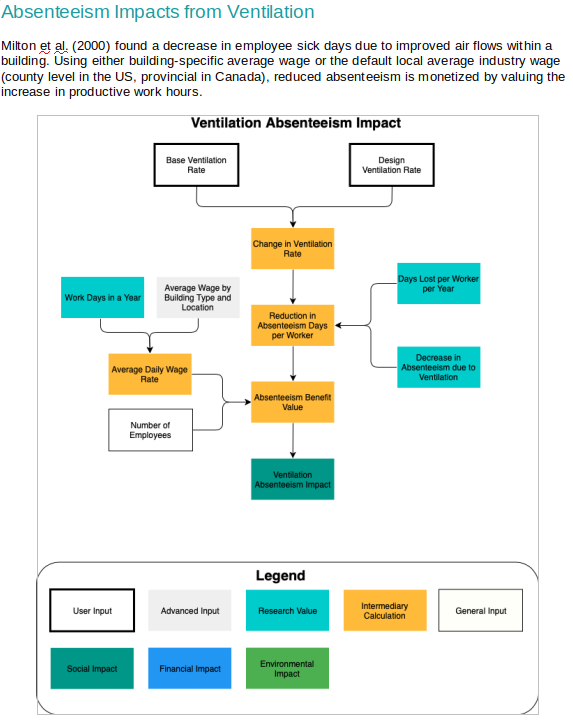
Miton et. al. found a decrease in employee sick days due to improved air flows within a building.
Autocase, puts a dollar value on the reduced absenteeism by valuing the increase in productive work hours.
Level 5: Show Me the Study Used for the Value.
Finally, you can click on the reference links in the sidebar to see the source studies. For example, Milton et al. (2000) :
Level 6: Enough of the Weeds … What’s the Big Picture?
In the word report (that you can export to Excel or Word from the download icon in the top right of the results section) the documentation is available (with the links to the source studies) but we also provide an overview structure diagram showing how the benefit is calculated:
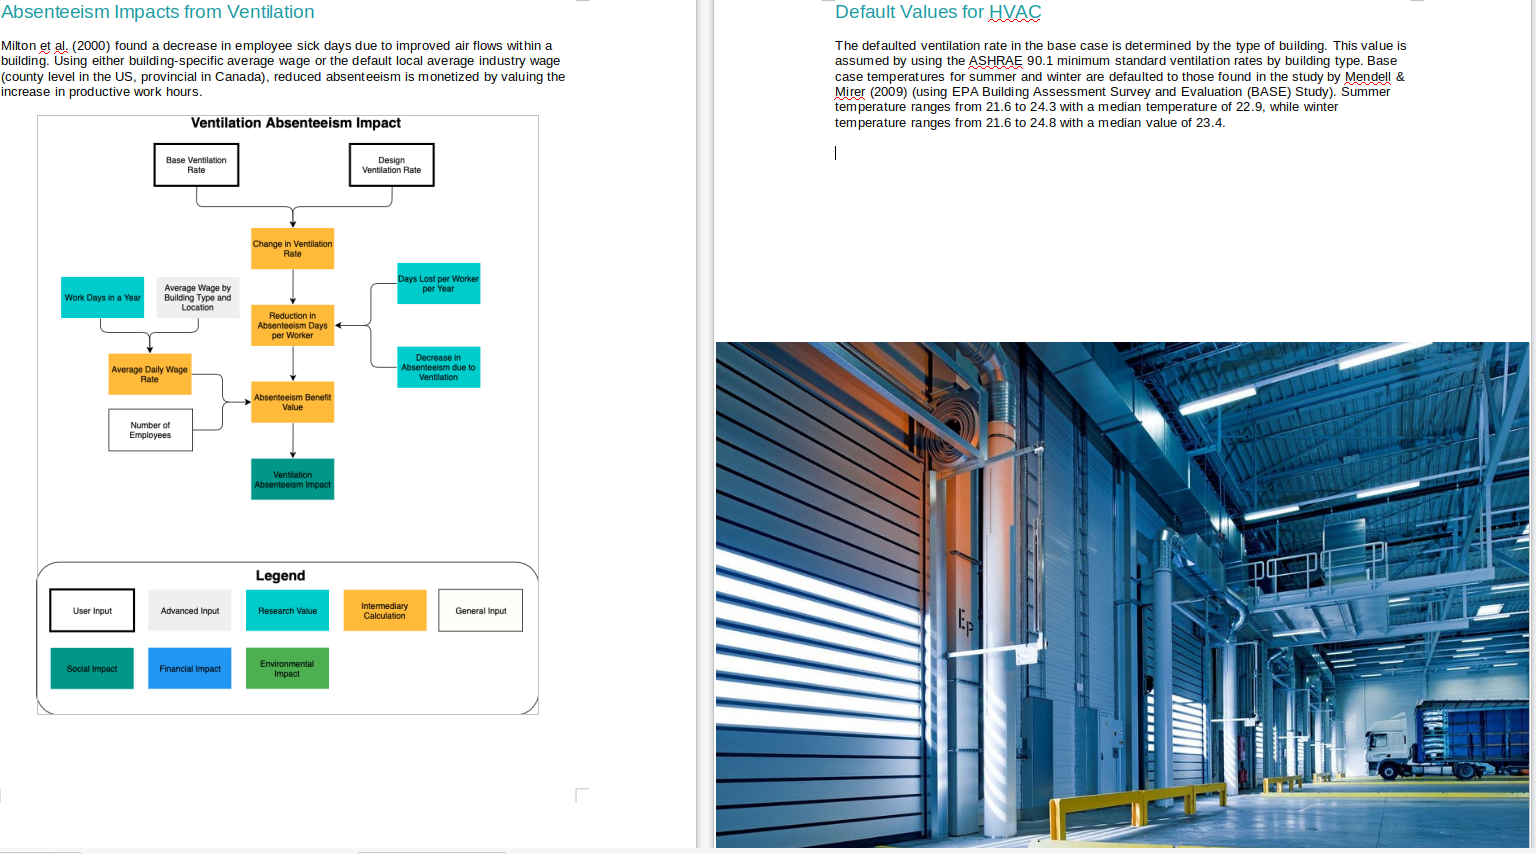
This structure diagram provides a high-level overview of how the absenteeism benefit from increased ventilation is calculated.
0 Comments