The price, or cost, or social cost of a tonne of carbon, or carbon dioxide, or CO2, is complicated. The estimates of climate change externalities change over time, have to be re-based, and the resulting carbon costs and benefits from infrastructure and buildings projects have to be discounted at a special discount rate (or rates).
If you want details, you can get them here.
But here at Impact Infrastructure, we are diving into the carbon weeds to make things simple for you when you use Autocase (for Sustainable Building and for Green Infrastructure). We’ll let you know when we have these update implemented in Autocase.
After wading through details here is how the range of US social cost of carbon (SCC) estimates grows over time:
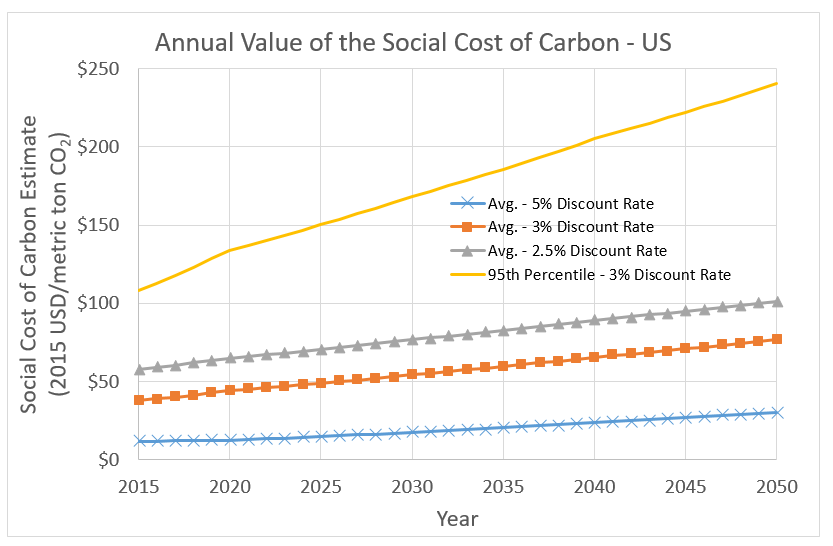
SCC – USD 2015$
In Canada, the the Canadian version of the SCC is the same as the US estimate mid-range estimate (but in CAD rather than USD) but the 95th percentile is higher. Also Canada eshews the upper and lower estimates in the US range:
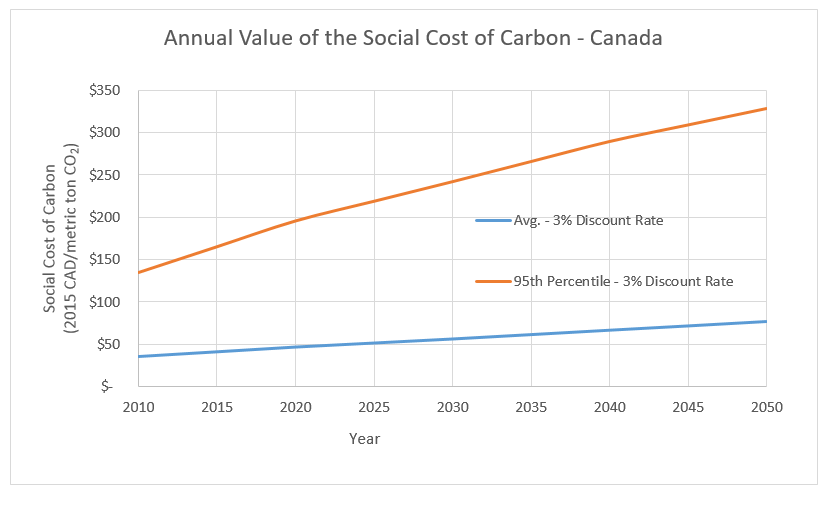
SCC CAD 2015$
Summary – US
| US
(USD 2015$) |
Value in 2016 | Annual Growth
2010-2020 |
Annual Growth
2020-2030 |
Annual Growth
2030-2040 |
Annual Growth
2040-2050 |
Discount Rate | Value in 2050 | Base Year Conversion |
| Low | $11 | 1.2% | 3.4% | 3.0% | 2.6% | 5% | $26 | CPI |
| Medium | $38 | 3.2% | 2.1% | 1.9% | 1.6% | 3% | $69 | CPI |
| High | $57 | 2.4% | 1.7% | 1.5% | 1.3% | 2.5% | $95 | CPI |
| 95th Percentile | $108 | 4.3% | 2.4% | 2.0% | 1.5% | 3% | $212 | CPI |
Summary – Canada
| Canada
(CAD 2015$) |
Value in 2016 | Annual Growth
2010-2020 |
Annual Growth
2020-2030 |
Annual Growth
2030-2040 |
Annual Growth
2040-2050 |
Discount Rate | Value in 2050 | Base Year Conversion |
| Medium | $42 | 3.2% | 2.1% | 1.9% | 1.6% | 3% | $77 | GDP Deflator |
| 95th Percentile | $172 | 4.5% | 2.4% | 2.0% | 1.3% | 3% | $329 | GDP Deflator |
0 Comments